
| Response | Number | % |
|---|---|---|
| I have never vaped | 12,273 | 84.4 |
| I have vaped once or twice | 1,171 | 8.1 |
| I used to vape, but I don’t now | 337 | 2.3 |
| I vape occasionally (less than once a week) | 240 | 1.7 |
| I vape regularly (once a week or more) | 345 | 2.4 |
| Did not answer | 173 | 1.2 |
Abstract
Recent evidence suggests youth vaping has plateaued, with 7% of young people vaping regularly. However, previous rises in rates of vaping among young people prompted government intervention to curb accessibility and appeal to minors.
Concerns around vaping in young people included potential “gateway” effect to tobacco smoking, although evidence for this is lacking. Other concerns are specific to vaping in schools, which includes children leaving lessons to vape, and nicotine addiction affecting students’ concentration in class.
Motivations for vaping vary among young people in England, including for curiosity, joining in with peers, or to deal with stress or anxiety. While awareness of the associated health risks is relatively high, misconceptions persist, contributing to the normalisation of vaping among adolescents.
Health inequalities are an important area, with the proportion of adults who smoke tobacco in the most deprived areas of England and Wales being more than three times higher than in the least deprived areas.. Little evidence is available on the association between deprivation and vaping, particularly in young people. However, associations between socioeconomic disadvantage and vaping among young people (10-to-15) have been observed.
In the data collected for the latest YPHWS cohort (2024), there were 14,366 students out of a total of 14,539 students who answered the question “Thinking about vaping / e-cigarettes only, which of the following best describes you?” The breakdown of the responses is shown in the table below:
We analysed the relationship between levels of deprivation (IMD Quintile) and young peoples’ propensity to vape. Deprivation data were only available for 56% of students (n = 8,125).
We found that students from the most deprived areas were more likely to report vaping regularly than those from less deprived areas. In addition, those reporting low life satisfaction were more likely to report both occasional and regular vaping.
Methods
Through YPHWS, we asked pupils about their vaping behaviour: “Thinking about vaping / e-cigarettes only, which of the following best describes you?”. Based on responses to this question we categorised pupils as those who do not occasionally or regularly vape, those who regularly vape, those who occasionally vape, and a combined group of occasional and regular vapers.
The pupils reported home postcode was used to classify level of deprivation. Deprivation was categorised into quintiles based on the Index of Multiple Deprivation (IMD).
For the analysis on level of deprivation and propensity to vape we perform a logistic regression, adjusting for relevant covariates. This is a form of regression analysis where the response variable is binary (i.e. Yes/No). From the logistic regression, we can evaluate what predictors have an effect on the outcome of the response variable. The estimate of association we report here is the Odds Ratio (OR)
As the response variable for life satisfaction has more than two (i.e non-binary) choices, we instead perform a chi-squared test for this part of the analysis.
Additional details on the methodology
The analysis is cross-sectional, and does not confirm causation. We cannot test if the predictor causes the outcome with this data or analysis.
In the logistic regression outputs below, there is a baseline/reference group (IMD Quintile 5 - least deprived), which other groups are compared against. The logistic regression determines whether each group is more or less likely to have a certain characteristic (e.g. to have a mental health condition), compared to the reference group. Each group has an Odds Ratio and an associated confidence interval, in which we can be 95% certain the real value lies in. Groups can be determined to be significantly different from one another if the intervals do not overlap, or the baseline group does not fall within the groups interval.
A statistically significant relationship between the explanatory and response variables is outlined when the p-value is lower than the 0.05 threshold. In this case, the p-value is small enough to reject the null hypothesis of the conducted test, which is that there is no relationship between the variables.
Results
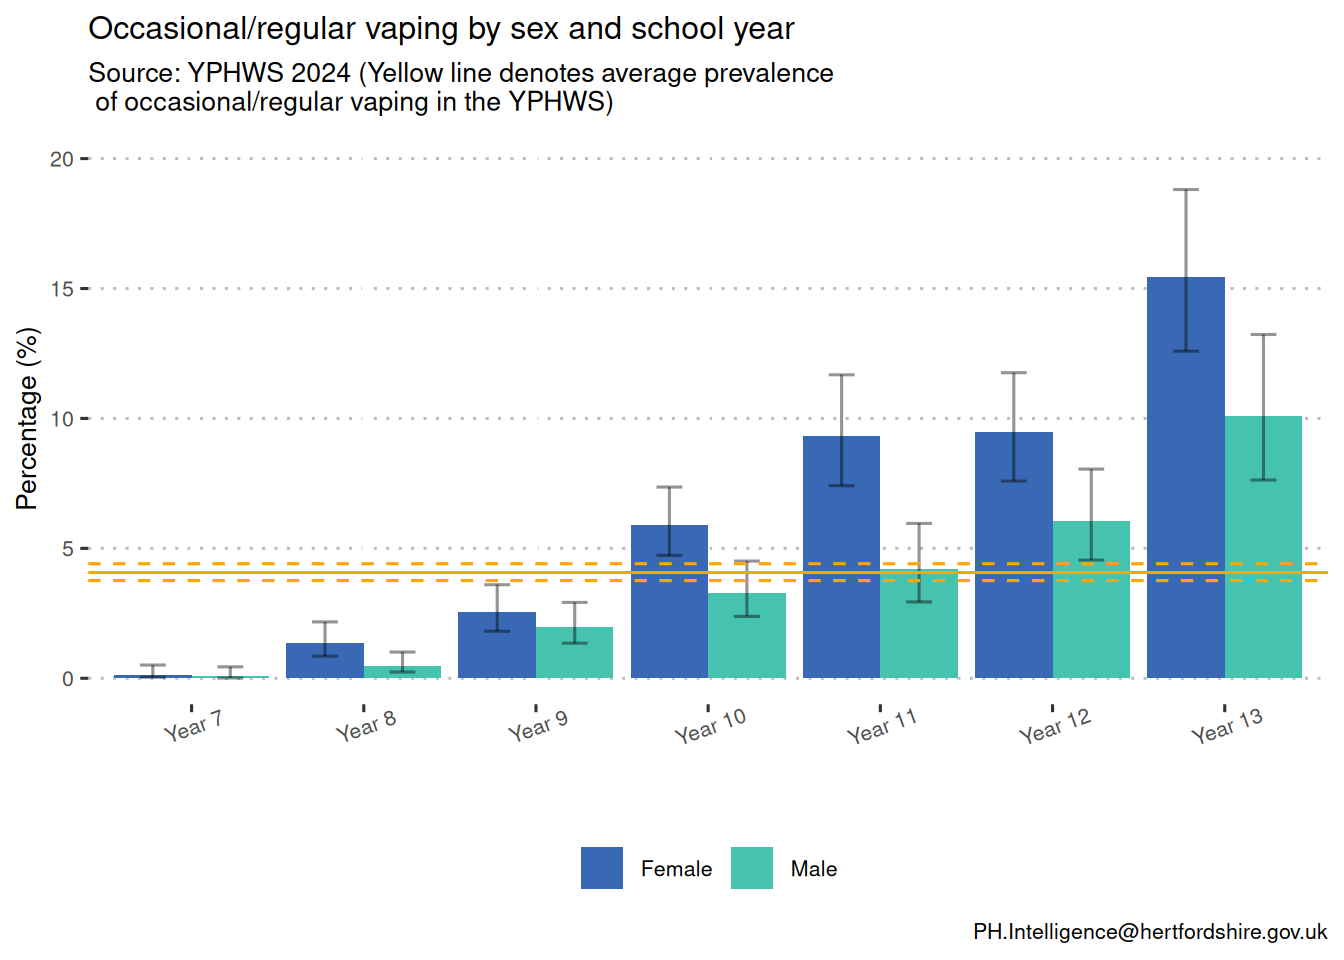
The plot below visualises the differences in vaping propensity across gender and school year. As we might expect, the percentage of pupils who reported occasional or regular vaping appears to increase with school years, regardless of gender. Notably, females consistently showed a higher likelihood of reporting vaping compared to males. This difference is statistically significant for Years 10 and 11.
Additional gender breakdown
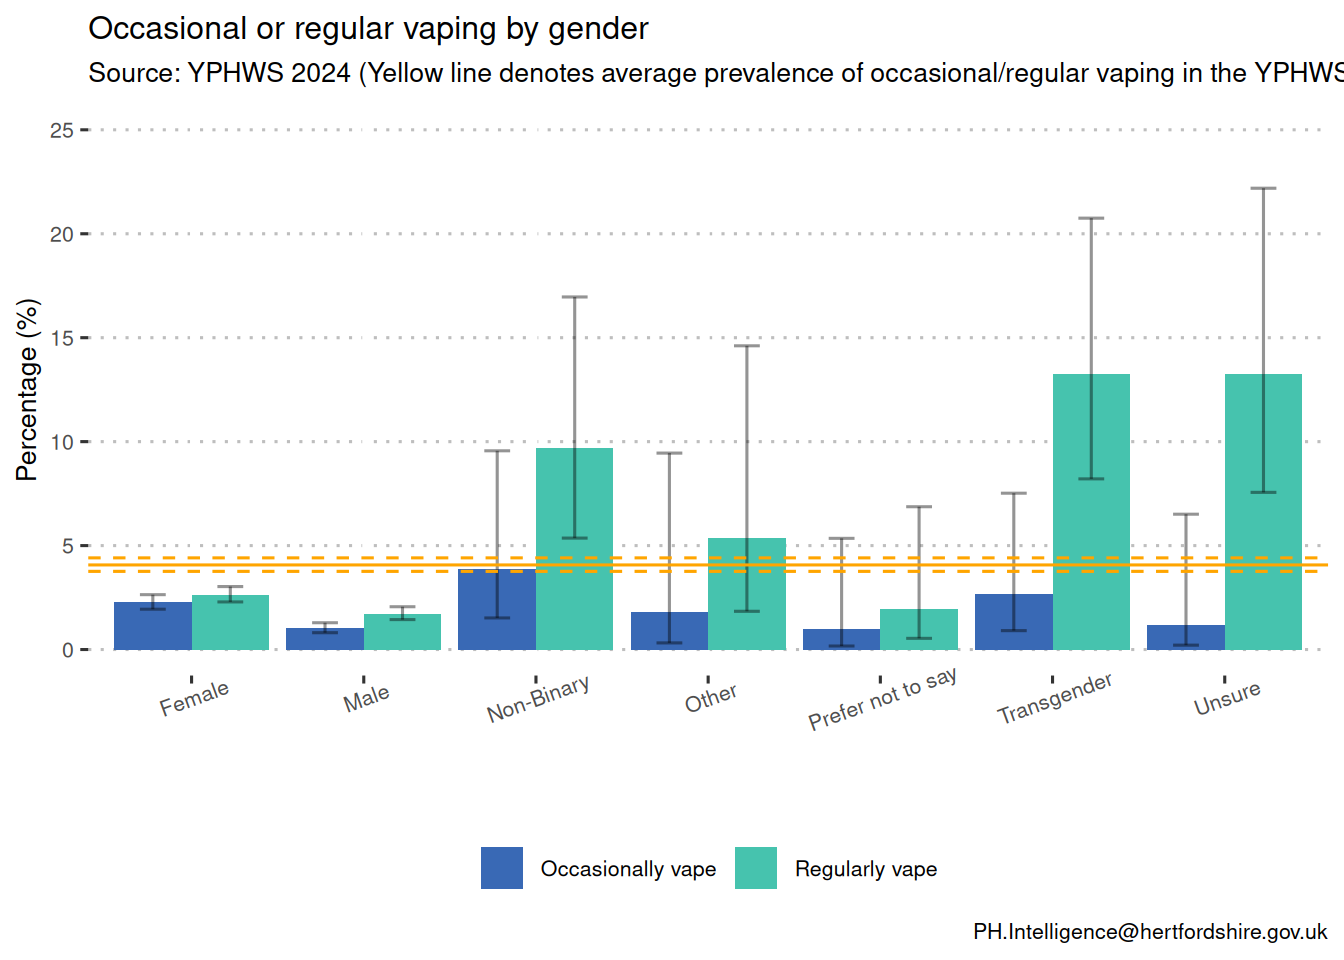
Plotting the relative percentage of occasional and regular vaping across all reported genders shows higher levels of regular vaping in genders other than male and female. Note: the numbers of those identifying as genders other than male and female are low, and therefore caution is advised when interpreting this plot.
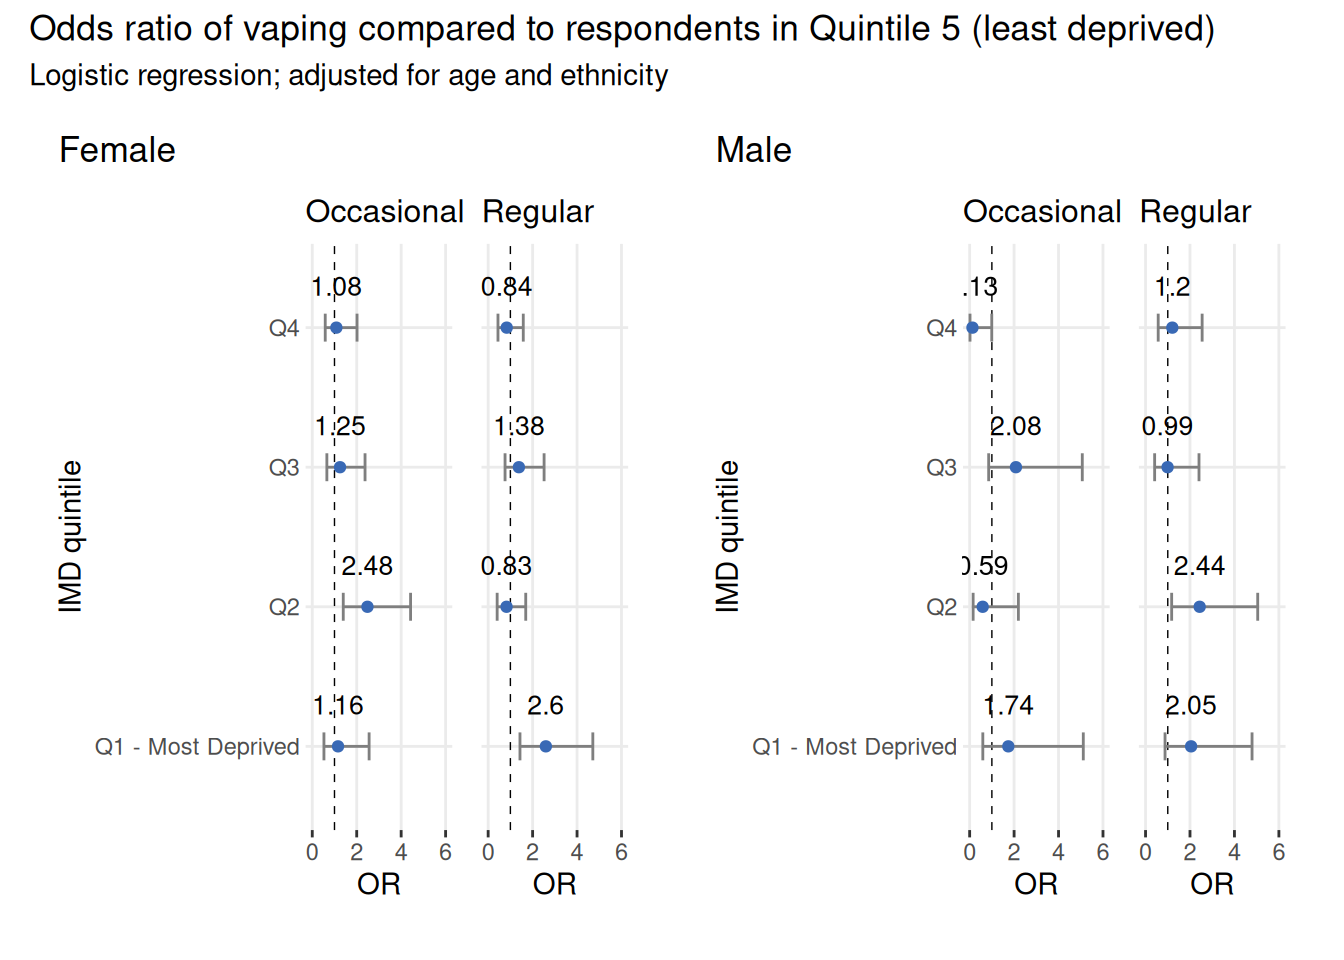
Occasional vs regular vaping
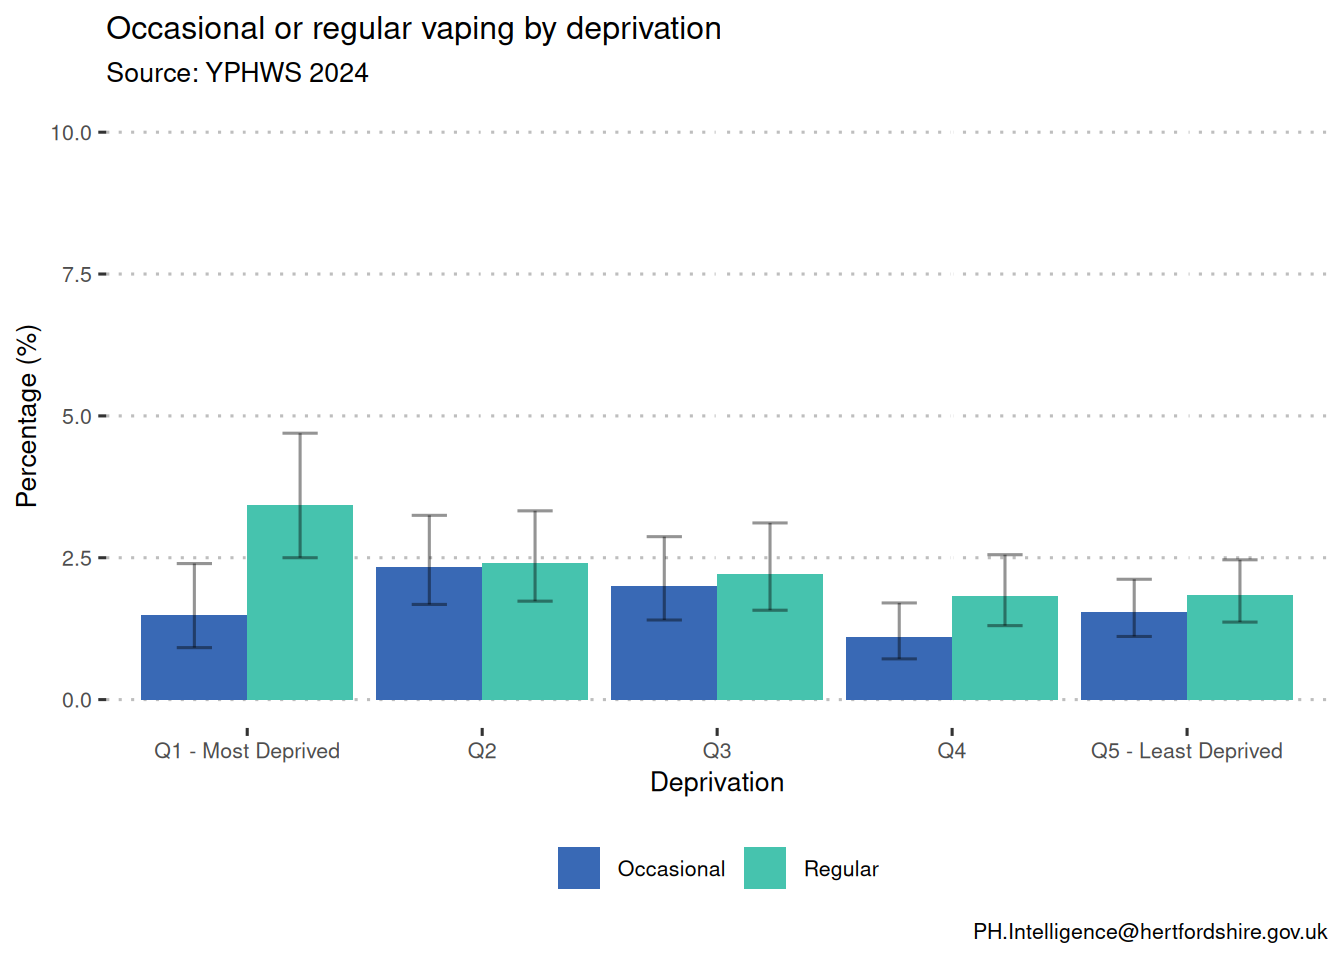
The likelihood of vaping (occasional or regular) has a slight tendency to increase for pupils from more deprived areas (most prominently in regular users), compared to those from the least deprived areas.
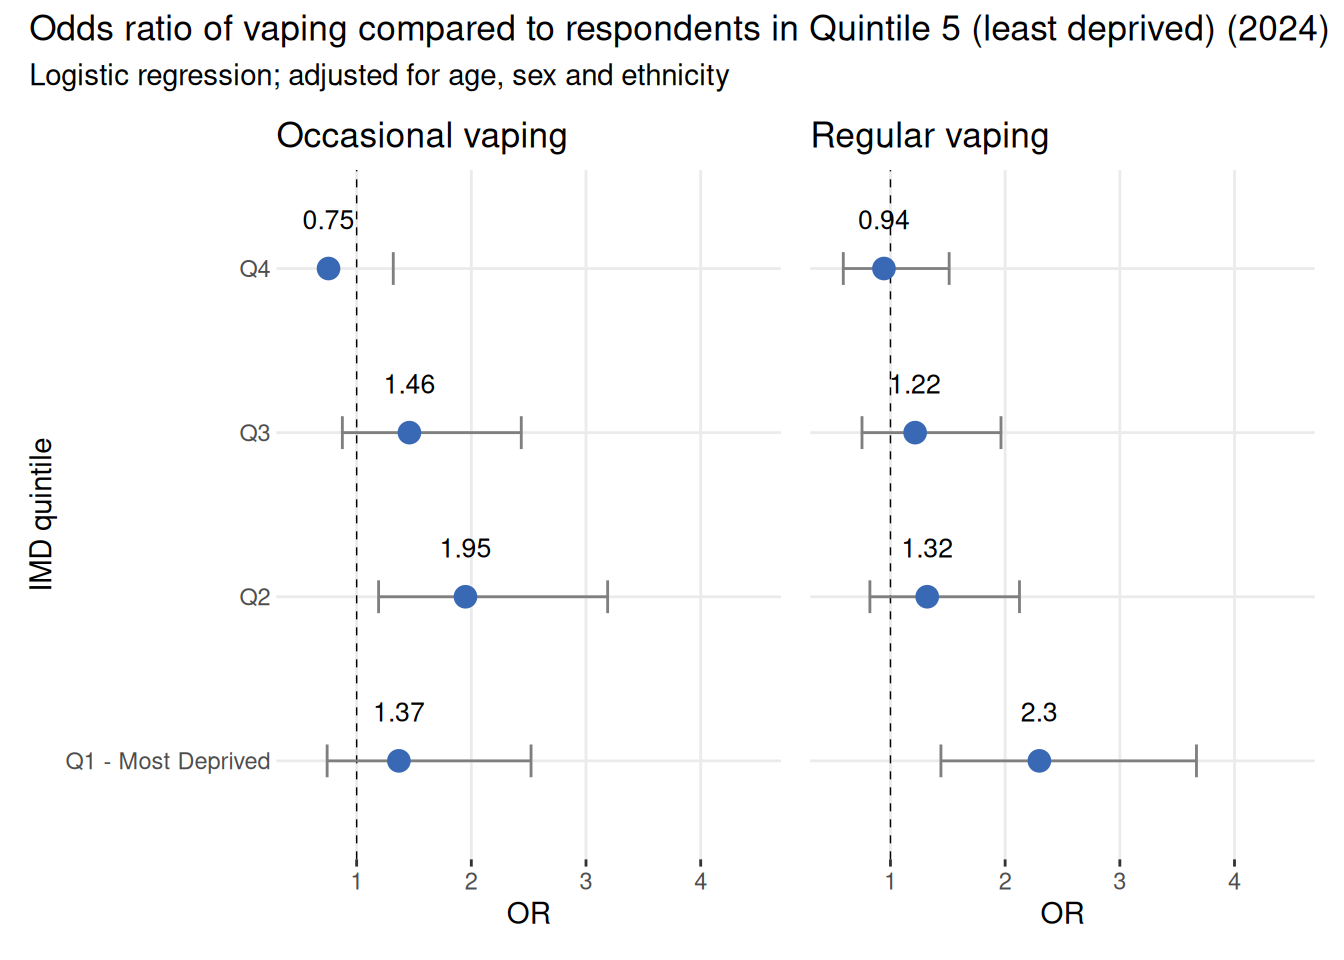
For both regular and occasional vaping, the OR tends to increase with deprivation, with the highest odds in the most deprived group (Q1) for regular vapers, and in Q2 for occasional vapers. For regular vaping, pupils in Quintile 1 had an OR of 2.3, meaning young people from the most deprived areas in Hertfordshire were 2.3 times more likely to regularly vape compared with the least deprived areas. For occasional vaping, pupils in Quintile 2 had an OR of 1.95, meaning young people from the second most deprived areas in Hertfordshire were 1.95 times more likely to regularly vape compared with the least deprived areas. Note: the wide confidence intervals observed are due to small sample sizes so we only discuss statistically significant differences. .
Gender and deprivation
When examining the odds of combined vaping (occasional and regular) by IMD quintiles separately for males and females, distinct patterns emerged. Among females, only those in Q1 (most deprived) had a significantly different OR of 2.6. For males, only those in Q2 had a significantly different OR of 2.44.
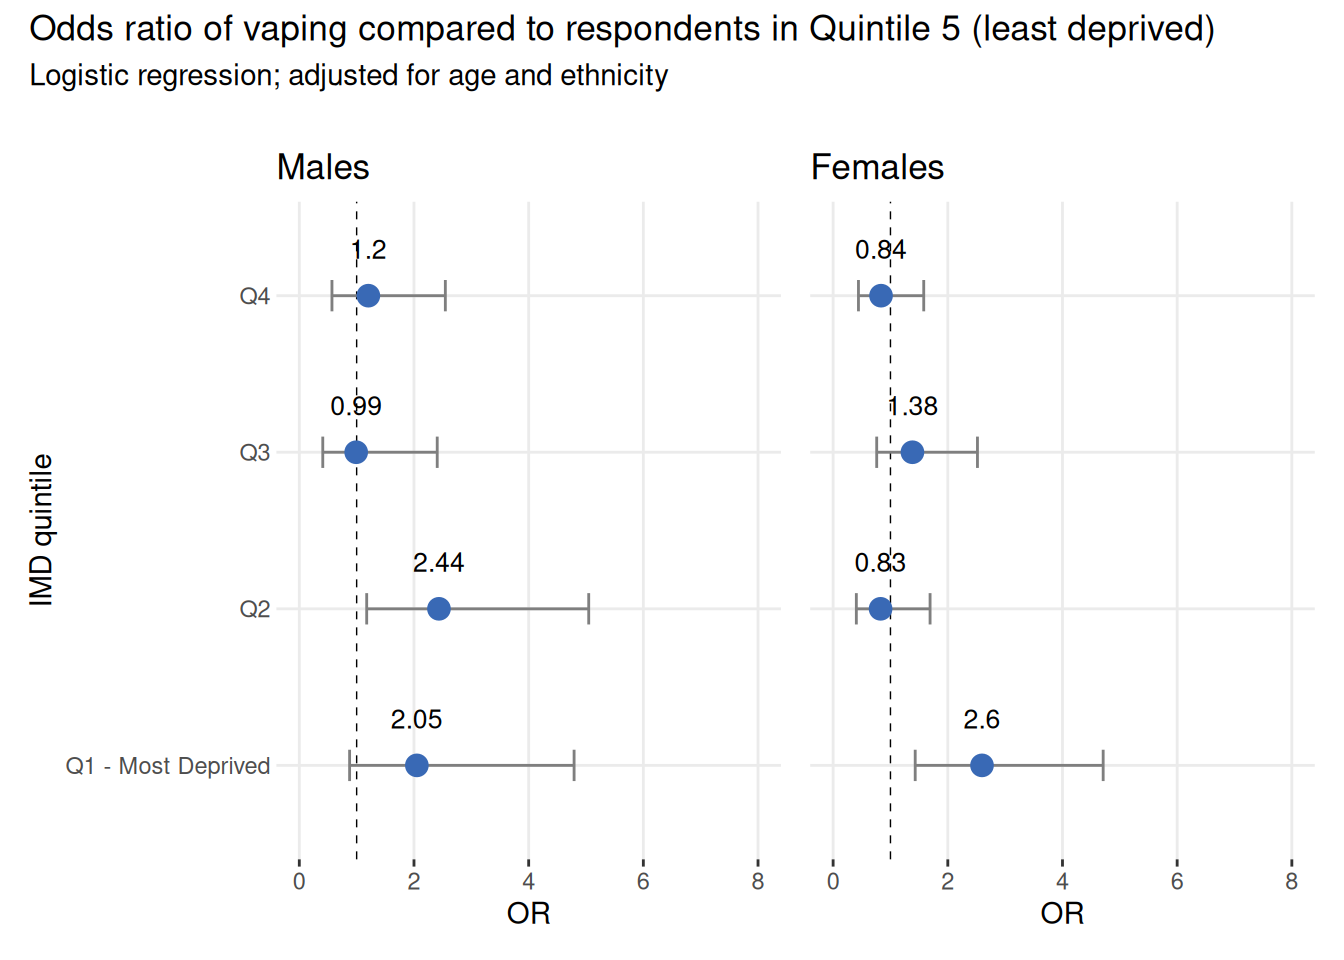
Additional gender analysis
Females in the most deprived quintile were 2.6 times more likely to vape regularly compared to those in the least deprived quintile. In the second most deprived quintile, they were 2.48 times more likely to occasionally vape than females from the least deprived quintile.
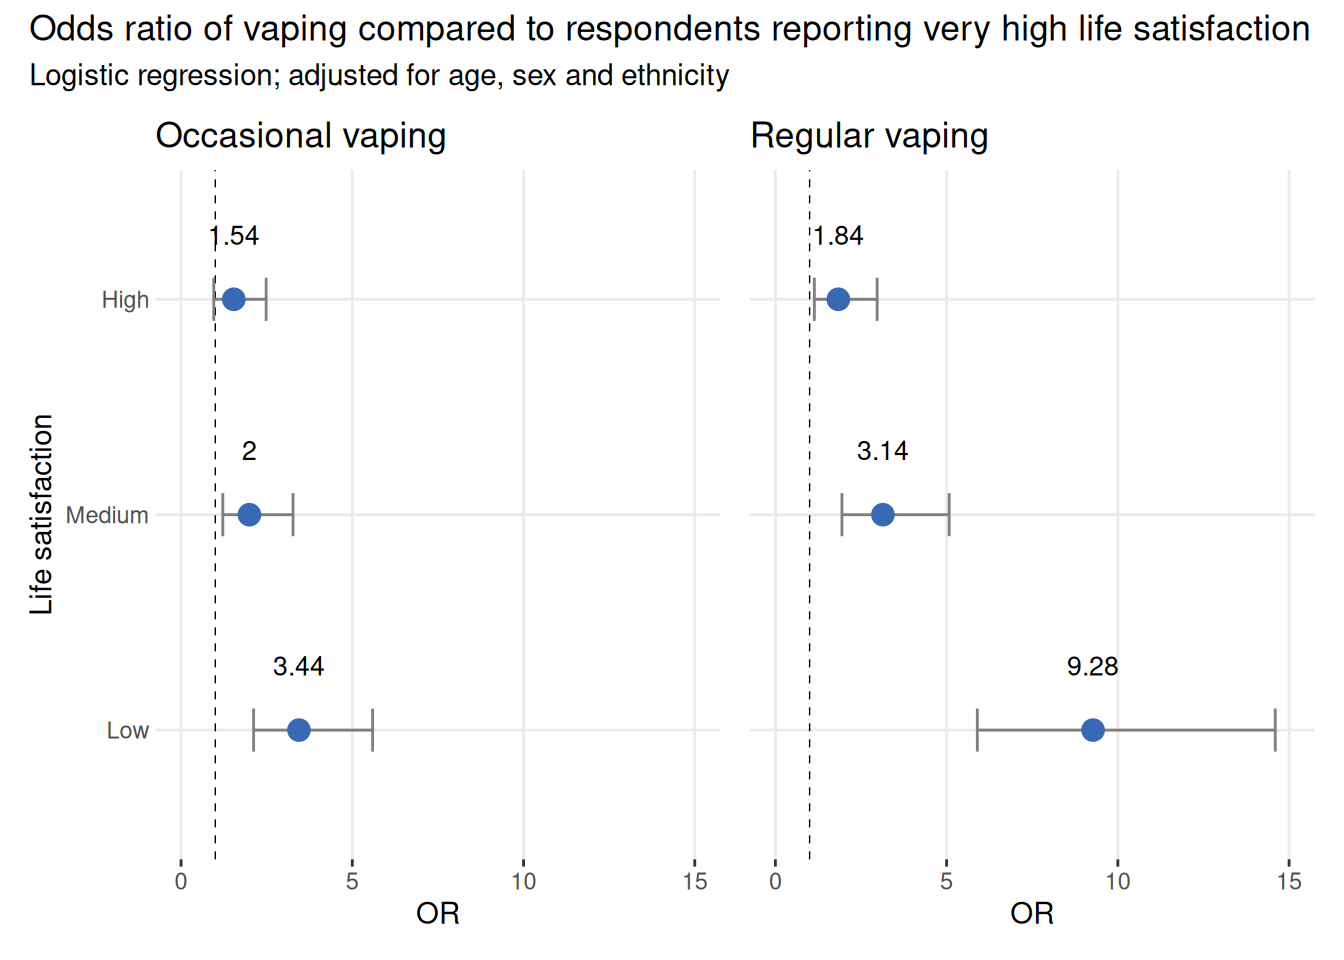
Life satisfaction
The odds of vaping, both occasional and regular, increased for pupils reporting low life satisfaction, compared to those reporting very high life satisfaction. Those reporting low life satisfaction were 3.44 times more likely to occasionally vape, and 9.28 times more likely to regularly vape, compared to those reporting very high life satisfaction.
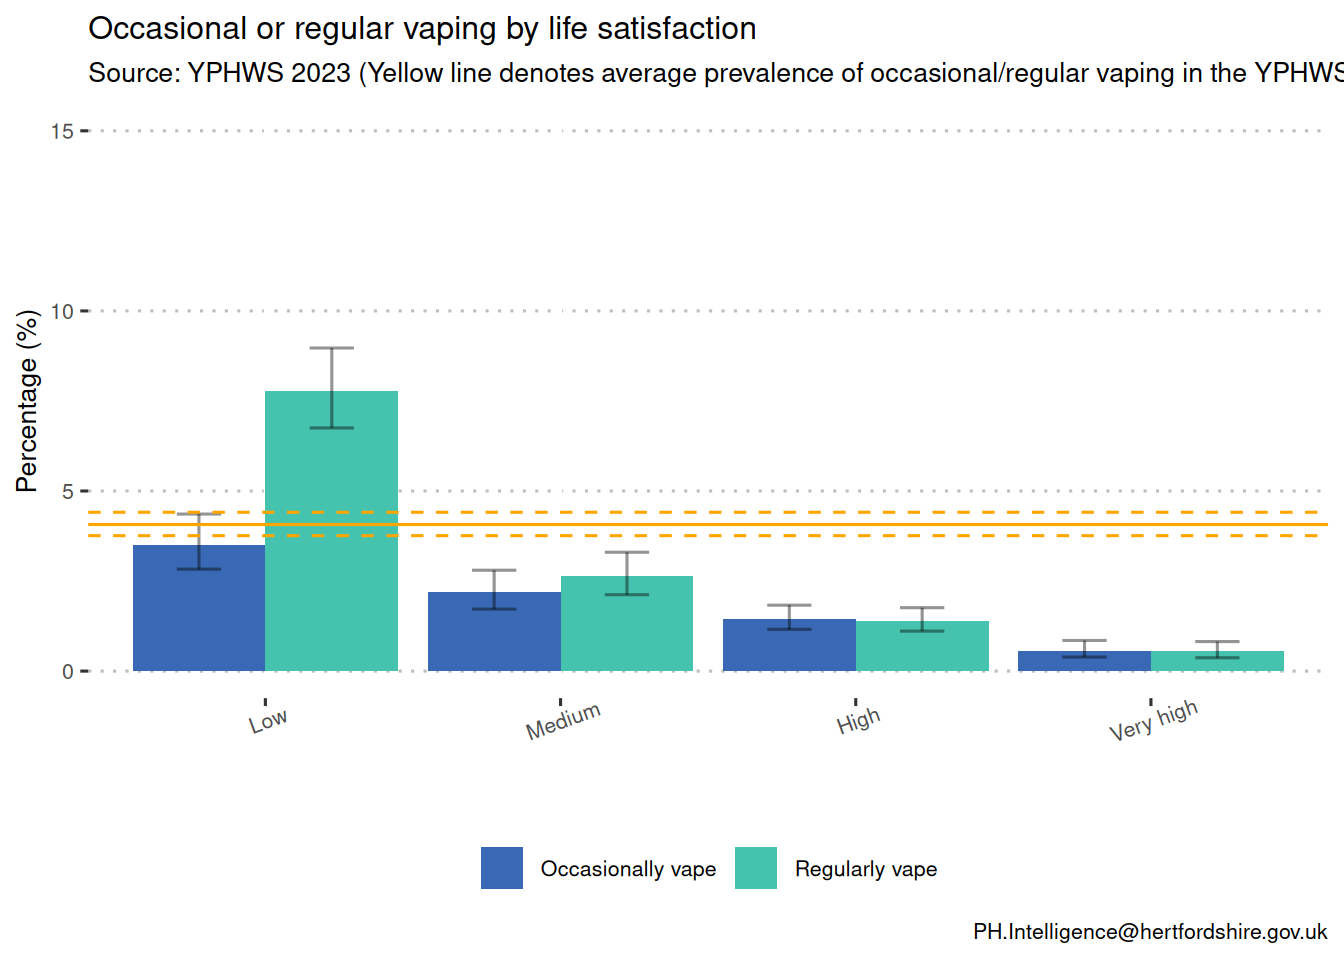
Life satisfaction breakdown
Plotting the relative percentages of occasional and regular vaping across different levels of life satisfaction reveals that students with low life satisfaction have the highest rates of vaping, both occasionally and regularly.
Conclusions
Among young people, those living in more deprived areas were more likely to vape, with the trend especially pronounced among females. Females in the most deprived areas were over 2.5 times more likely to regularly vape than those in the least deprived areas. Additionally, compared to individuals reporting very high life satisfaction, those with low life satisfaction were over three times more likely to vape occasionally and more than nine times more likely to vape regularly.